
Knight-Satchell-Tran Moving Average Crossover Model
Models upside and downside moves with separate Gamma distributions in a two-state Markov framework — capturing asymmetric risk — and derives exact expected-P&L formulas for moving-average crossover rules.
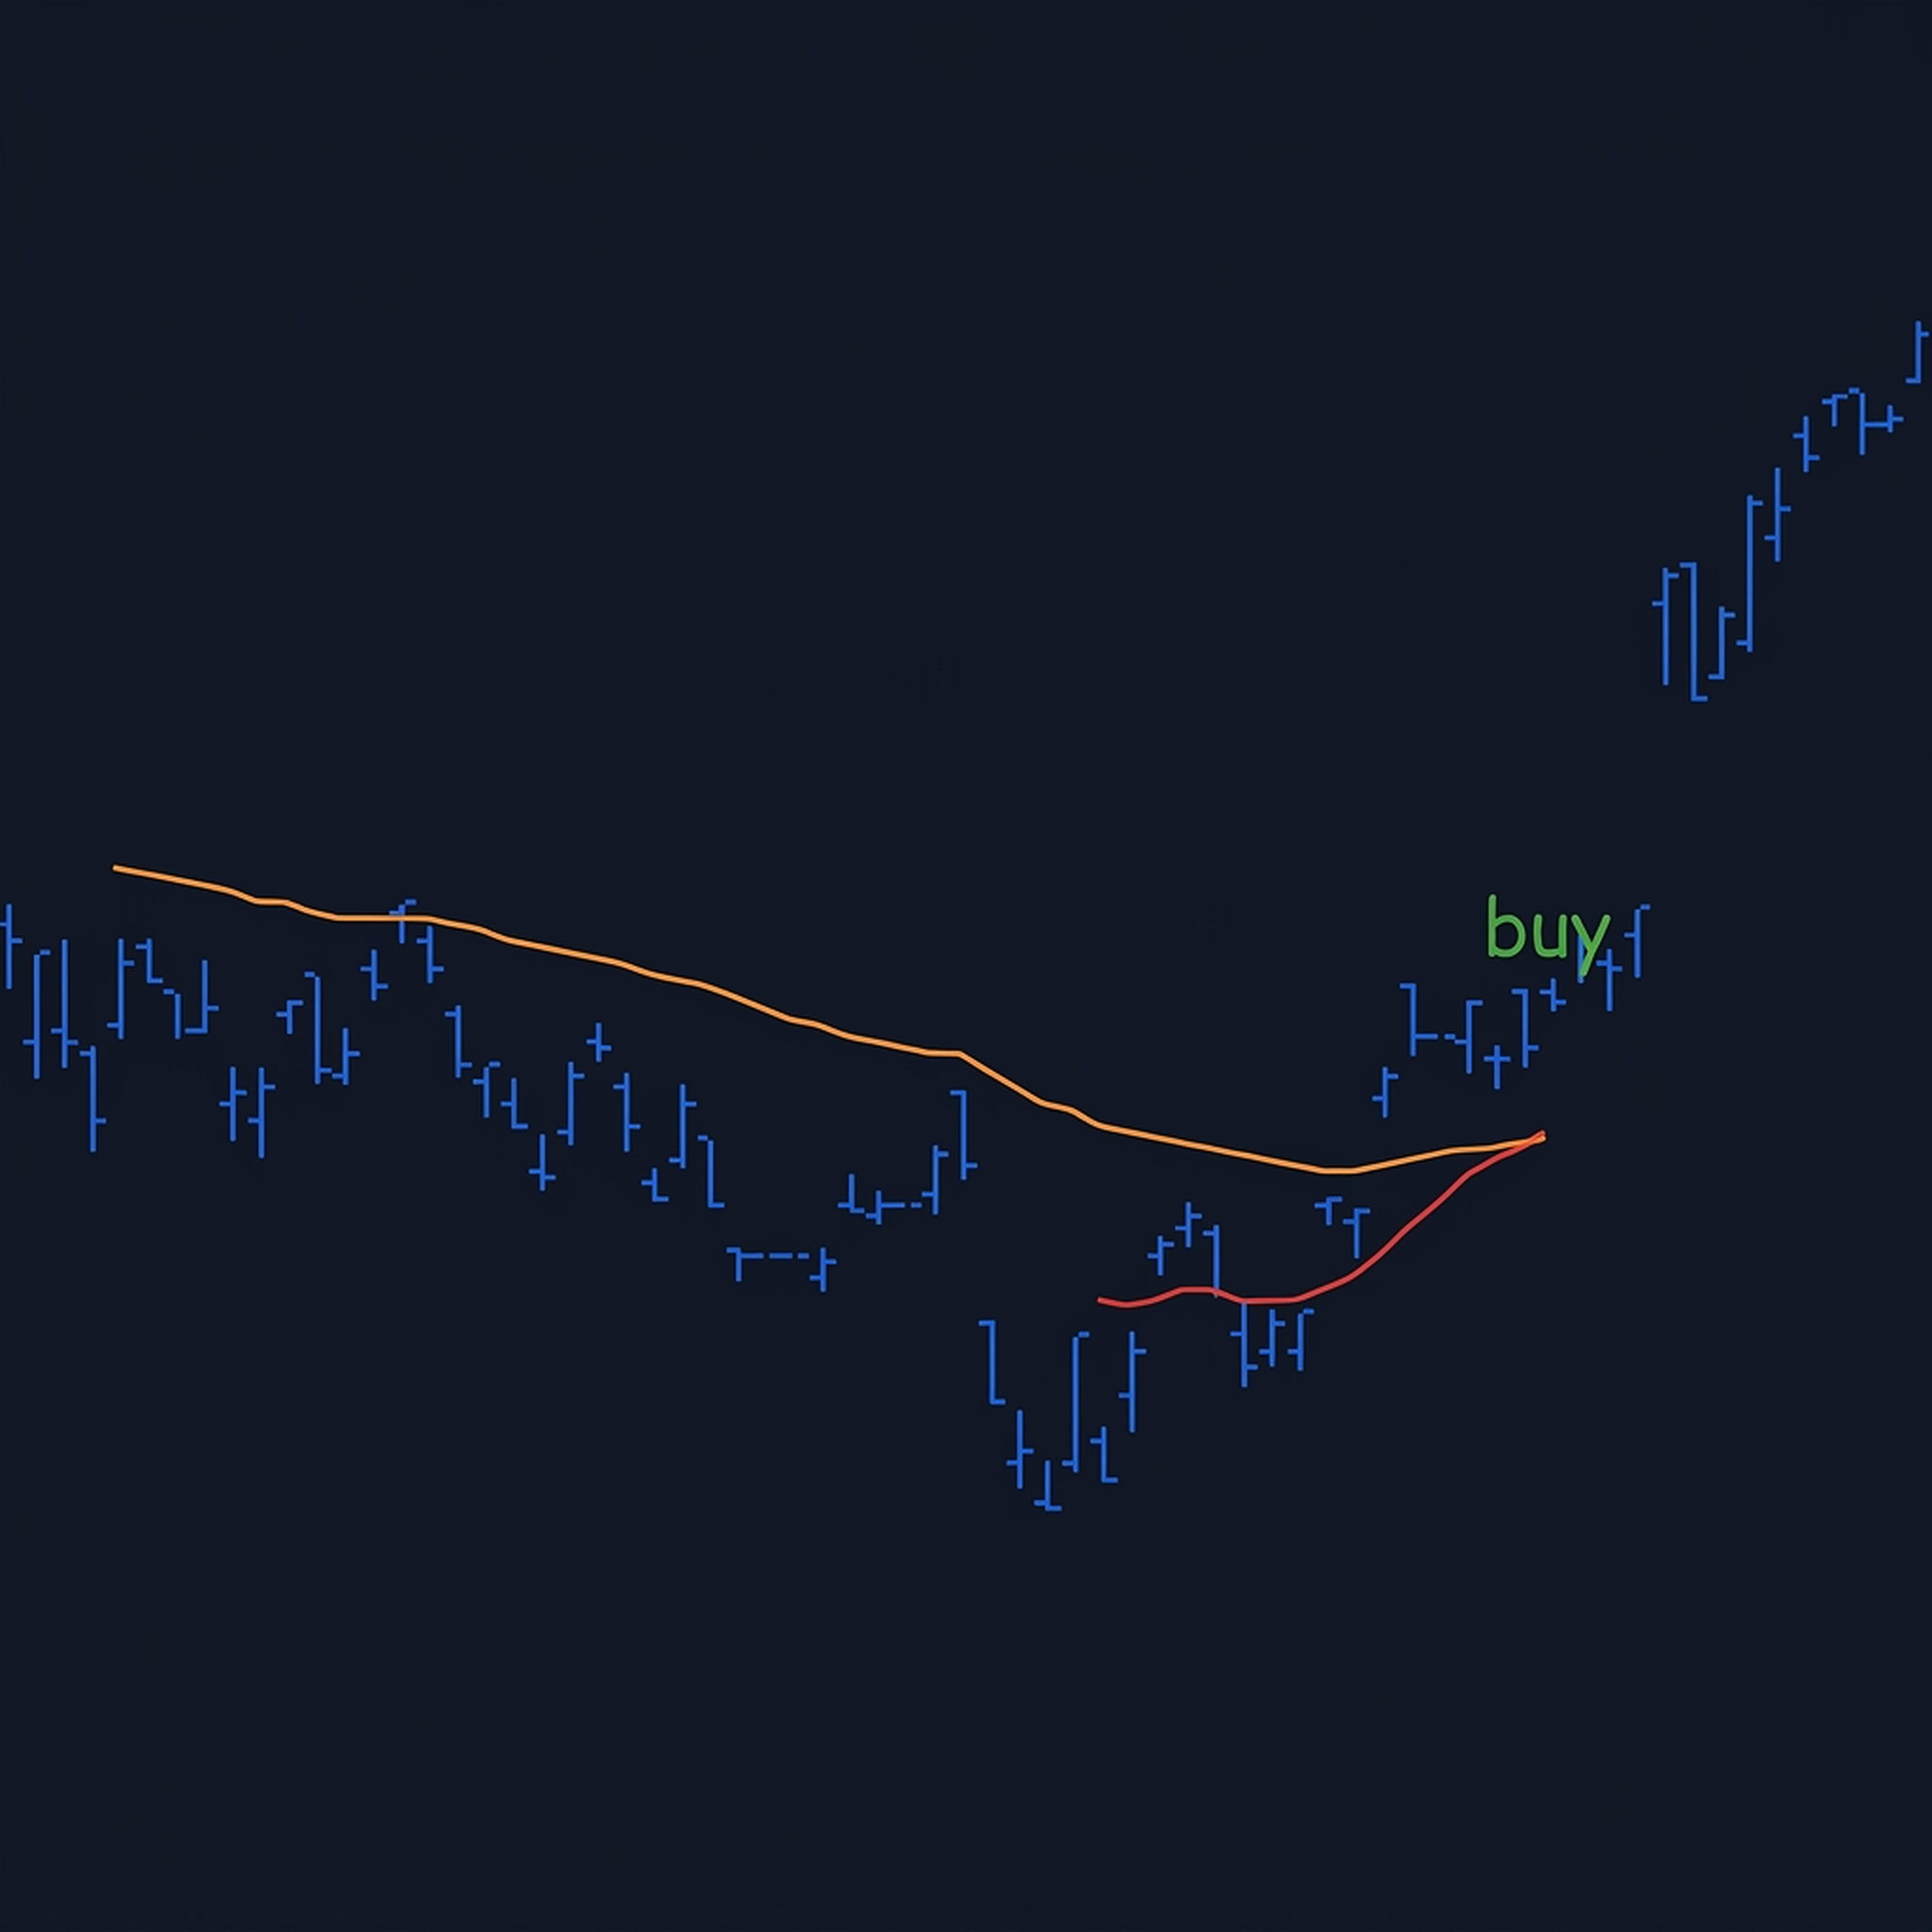
Standard symmetric return models cannot capture the empirically observed asymmetry between upside and downside moves. Knight, Satchell & Tran model positive and negative returns each with their own scale-Gamma distribution, so symmetry becomes a testable hypothesis — and on daily FT100 index and futures data it is rejected: asymmetry is statistically significant.
Daily returns follow a two-state Markov chain — UP and DOWN trends — with parameters measuring trend persistence and average move size. The framework connects directly to semi-variance and downside-risk measures used in portfolio theory.
Under this model the expected P&L of GMA(2,1) and GMA(∞,1) crossover strategies has a closed form. GMA(2,1) profits only when trends are persistent enough or moves large enough; GMA(∞,1), surprisingly, always loses in expectation.
The takeaway: linear trading rules should use a few recent data points, not all available history.
References
- Knight, J. L., Satchell, S. E. & Tran, K. C. (1995). "Statistical Modelling of Asymmetric Risk in Asset Returns." Applied Mathematical Finance, 2(3), 155–172. https://doi.org/10.1080/13504869500000009