
NMSAAM
The NM Stochastic Asset Allocation Model (NMSAAM) is a radically different approach to portfolio construction. Instead of assuming expected returns and covariances are known, it treats them as random — and estimates their distributions directly. From the same constituents as a static market index, it builds a dynamic, optimal index with a higher Sharpe ratio and lower volatility.
Why Markowitz fails in practice
- ›Markowitz (1952) mean-variance optimization requires the knowledge of expected returns and covariances.
- ›Estimating covariances may be possible; estimating expected returns is probably the single most challenging problem in finance.
- ›N assets need N + (N² + N)/2 parameters: 45,450 for 300 stocks, 4.5 million for 3,000 — and they vary over time with business cycles.
- ›Accurate estimates would need ~250 years of data for 25 assets, 500 years for 50 assets.
- ›Sample covariance matrices are ill-conditioned; inversion maximizes estimation error. Errors in means matter ~10× more than errors in variances (Chopra & Ziemba, 1993).
- ›After 60+ years and 1,000+ papers, equal weighting (1/N) remains a very tough benchmark to beat.
The missing portfolio variance
Observed historical returns are only one realization of an unknown joint distribution, so any mean or covariance estimated from them is itself random. Portfolio variance decomposes as Var(W) = E[w′Σₙw] + Var(w′μₙ). Plugging in estimates as if known silently sets the second term to zero — the root cause of failure for every Markowitz-based model.
Mean and covariance are random
Assume expected returns and covariances are not available, and therefore random.
Efficient methods to estimate the distributions of expected returns and covariances.
Optimize max { E(w′rₙ₊₁) − λ·Var(w′rₙ₊₁) } against the true stochastic distribution, with any extra constraints (long-only, cardinality, sector).
Two AlgoQuant implementations: a stochastic optimization solver and a functional approach that iteratively improves over a baseline model.
Empirical results
Fund allocation — China ETF pool vs. 1/N
- ›Rebalancing every 6 months, almost every parameter set outperforms equal weighting.
- ›Average P&L 2.26× that of 1/N; max 3.91×, min 1.6×.
- ›Sharpe ratio 0.45 vs. 0.14.
- ›Across the whole reasonable parameter space: max drawdown 27.72% vs. 42.79%.
- ›Rides rallies with controlled risk, limits drawdowns in crashes, and gives a smoother P&L in sideways markets.
Dynamic index — SZ50, Jan 2015 – Dec 2017
- ›Across all reasonable parameters: 93.75% of portfolios beat the index on Sharpe ratio, 73.44% on final P&L.
- ›On a stable parameter plateau: 100% beat the index on both Sharpe ratio and P&L.
- ›Sharpe ratio 27.11% higher and final P&L 18.87% higher than the index.
- ›Lower volatility and lower maximum drawdown.
Example of a fund allocation in China
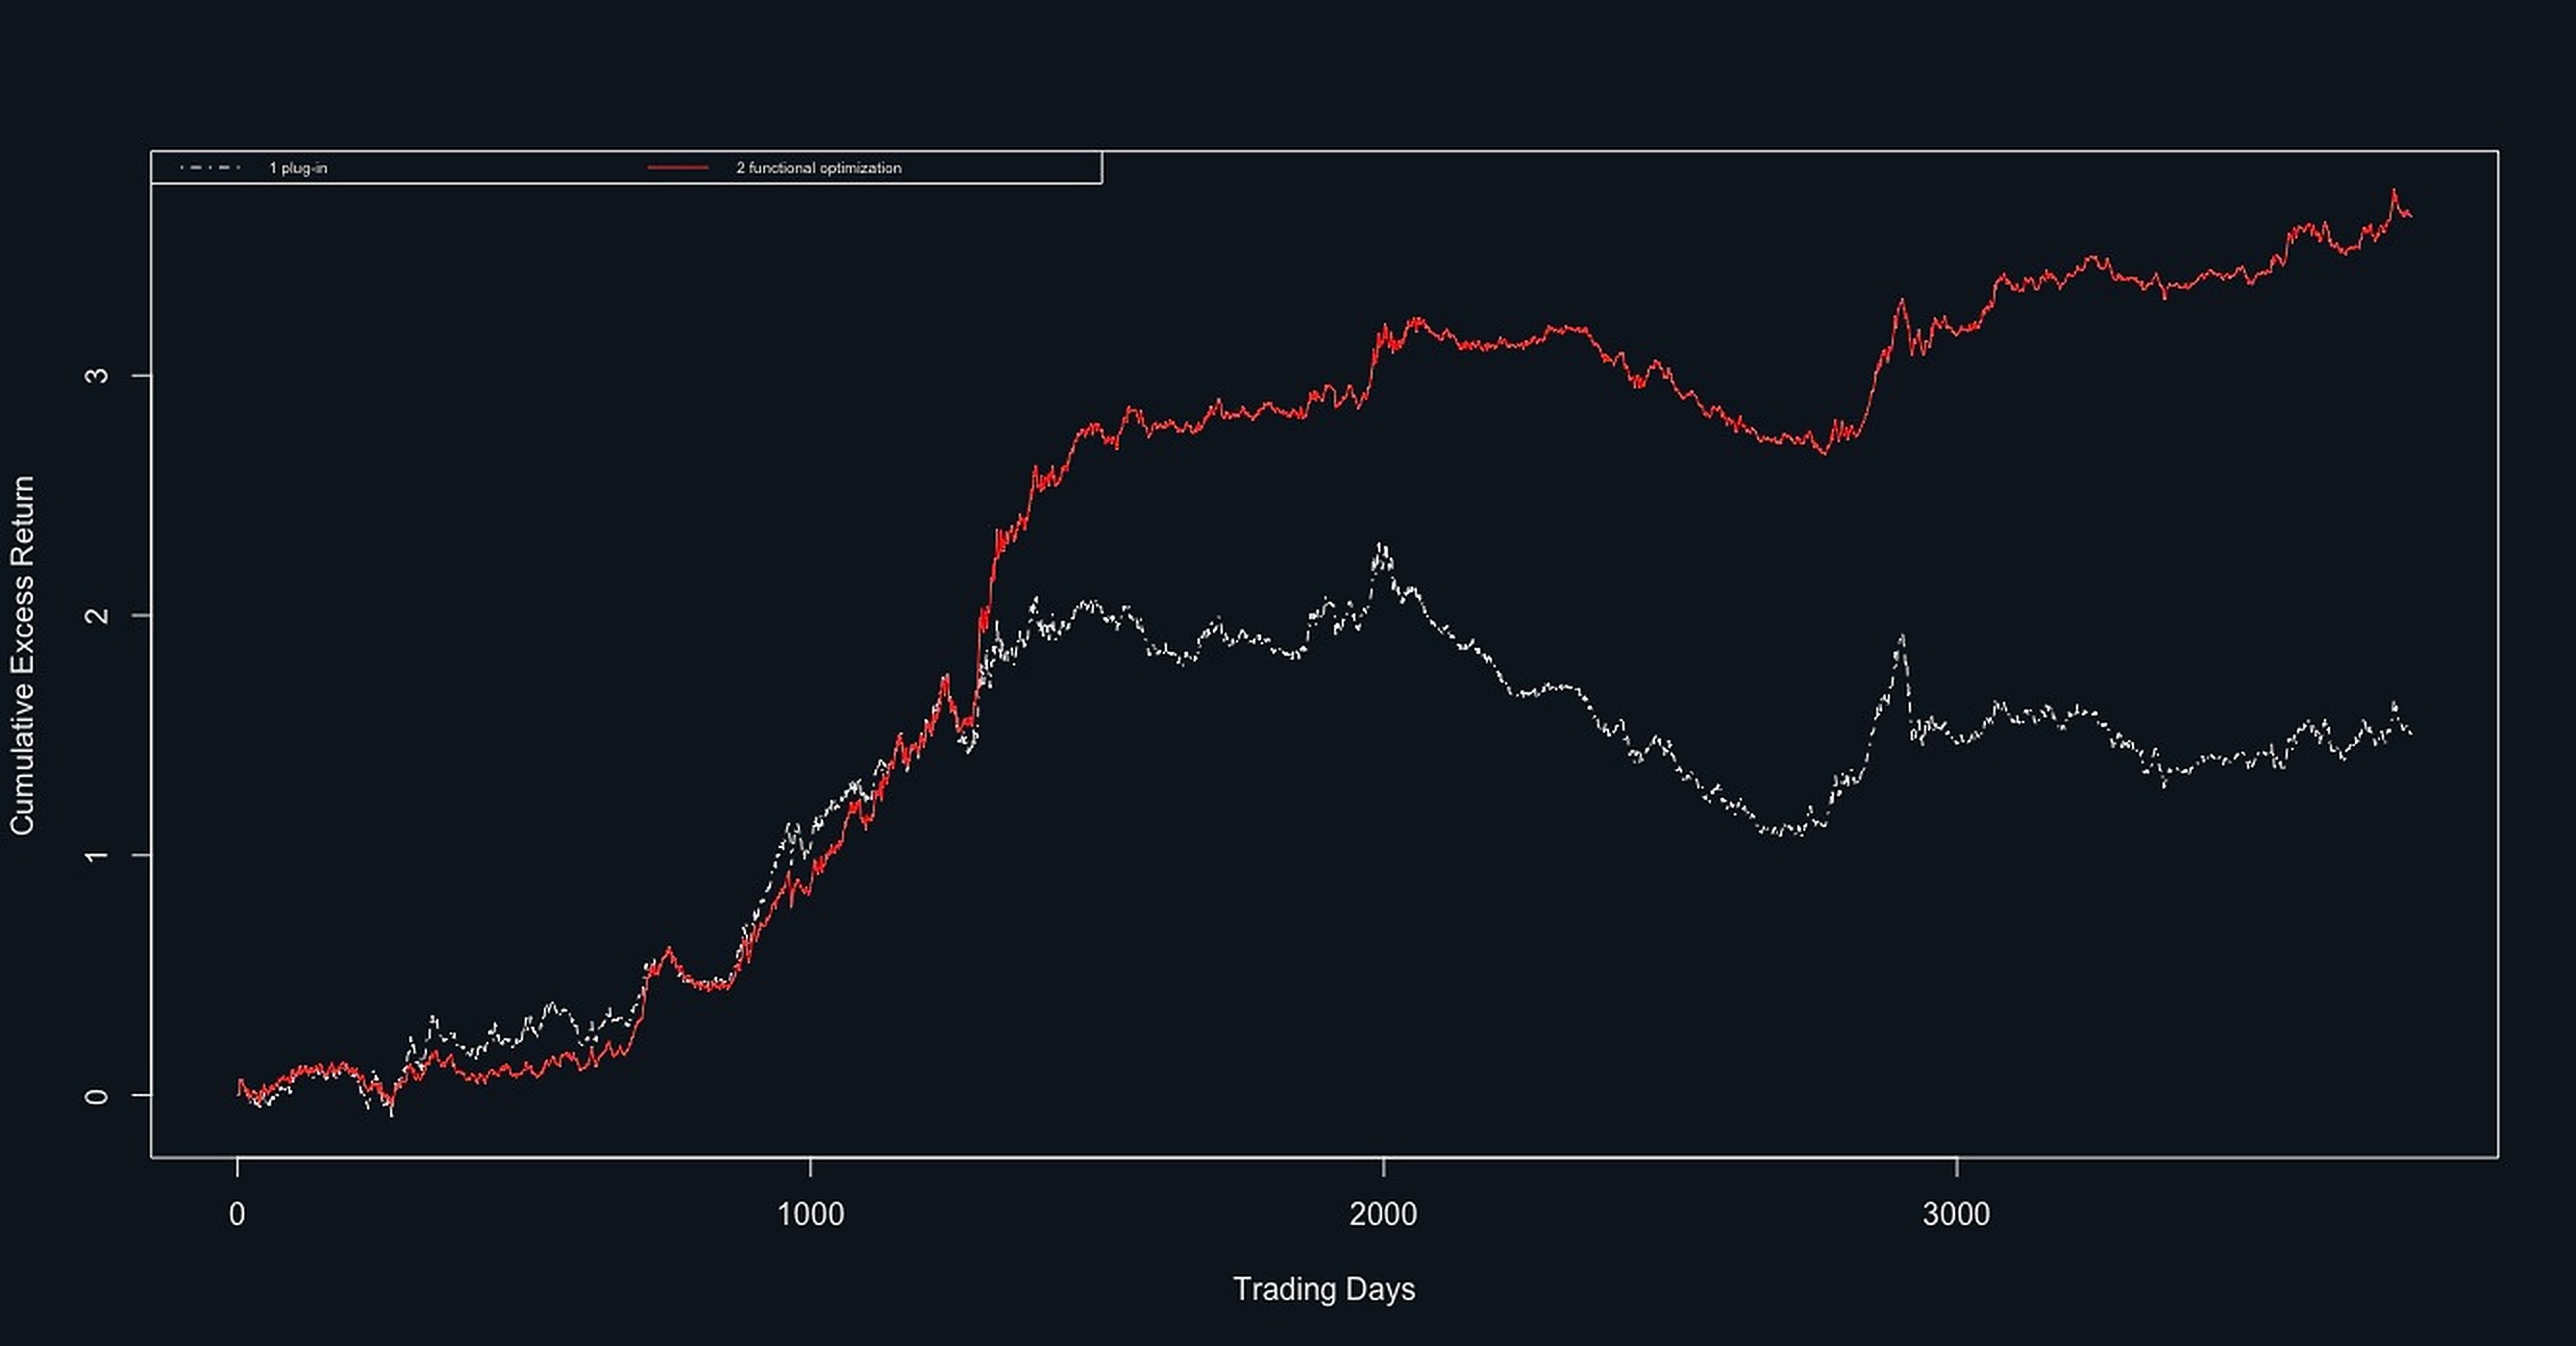
Cumulative return: Markowitz method vs. NMSAAM functional approach (benchmark: S&P 500).
| Objective | Target | λ bound | Markowitz | Functional |
|---|---|---|---|---|
| SR | Excess return | lb = 0 | 1.4765 | 3.6421 |
| SR | Excess return | lb = −0.02 | 1.5307 | 3.9408 |
| SR | Excess return | lb = −1 | 3.8609 | 8.3171 |
| SR | Return | lb = 0 | 1.5001 | 2.3749 |
| SR | Return | lb = −0.02 | 1.5102 | 2.2627 |
| MV (z₀.₉) | Excess return | lb = 0 | 1.5698 | 5.2983 |
| Objective | Target | Equal weight | Functional |
|---|---|---|---|
| SR | Excess return | −0.2053 | 2.1244 |
| SR | Return | 0.9092 | 2.2204 |
Empirical results
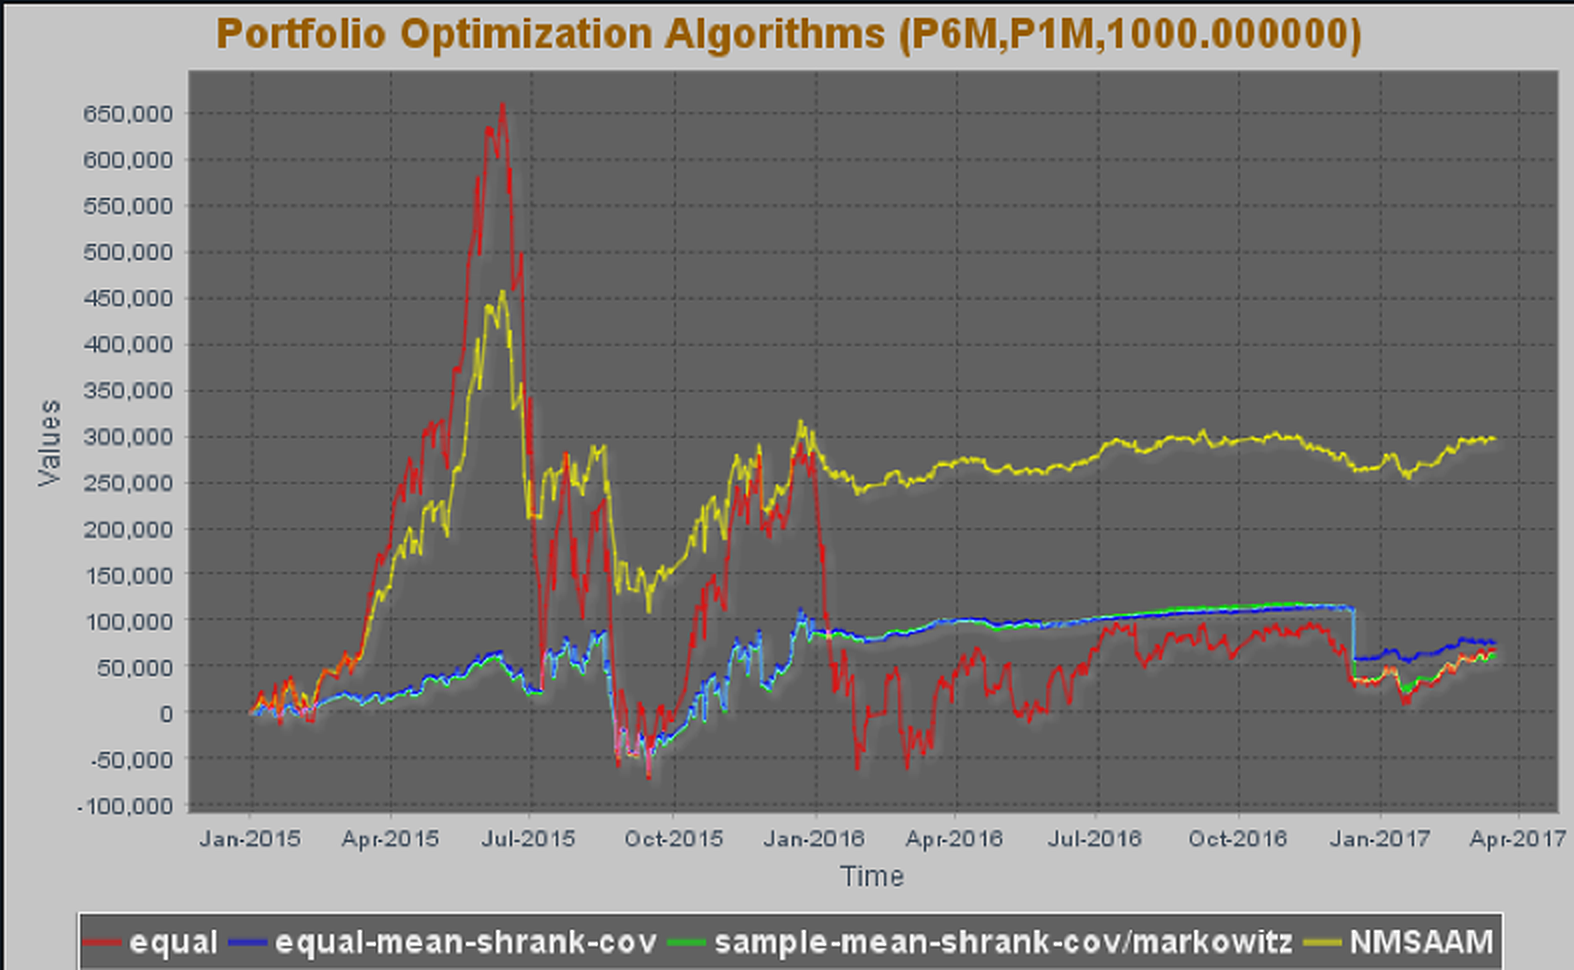
- ›Using a pool of ETFs provided by a bank in China, we compare NMSAAM's allocations to 1/N and other models.
- ›NMSAAM outperforms 1/N across a wide range of parameters — evidence of stability.
- ›When the market rallies, it rides the trend without going to extremes, giving risk-controlled profits.
- ›When the market crashes, it limits the drawdown.
- ›When the market moves sideways (since Jan 2016), it shows much lower volatility and a smoother PnL curve.
Best asset allocation theory
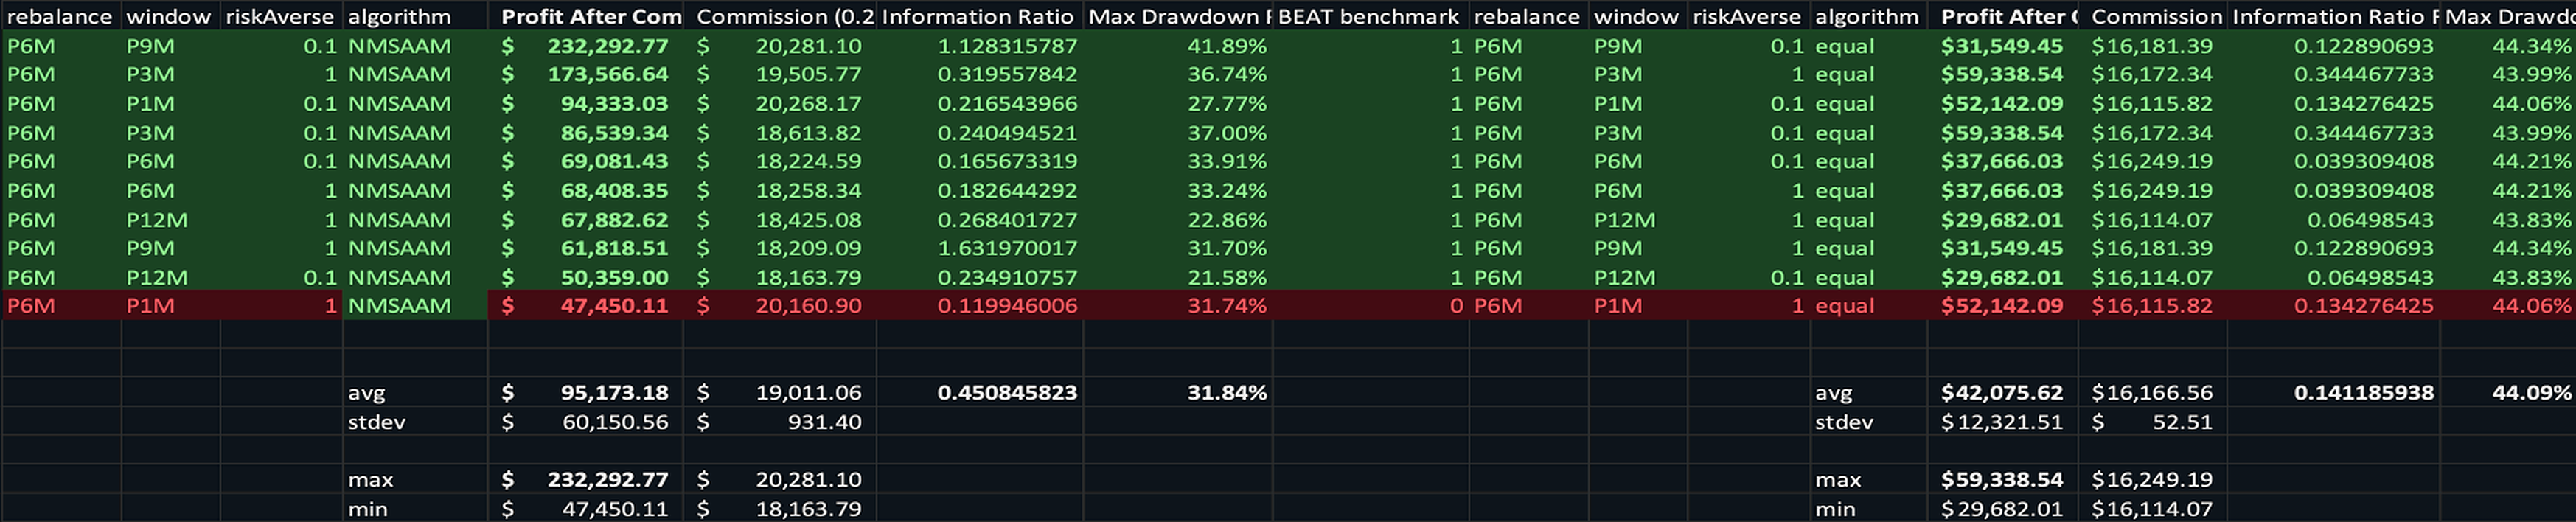
With 6-month rebalancing, all but one parameter set outperform 1/N.
- ›Across the whole reasonable parameter space, NMSAAM beats 1/N in 55.56% of cases on final PnL.
- ›Average PnL $64,265 vs. $53,052; max drawdown 27.72% vs. 42.79%; Sharpe 0.26 vs. 0.21.
NMSAAM consistently outperforms equal weighting and is probably the best asset allocation theory to date.
Indices, funds and derivatives
- ›Dynamic alternatives to SPX, CSI 300, HSI, FTSE 100, Euronext, DAX, Nikkei and Nifty — plus commodity and FX indices.
- ›Partial indices: a cardinality constraint tracks an index well with only a subset of stocks.
- ›Index funds and ETFs tailored to risk-averse investors such as banks, insurers and pension funds.
- ›Futures, vanilla options, principal-protected notes and structured products on NMSAAM indices.
- ›More effective portfolio hedging.
NM FinTech has sole ownership of the NMSAAM indices. In each market we are looking for a tier-1 financial partner to promote and market them — building an index business in the spirit of MSCI.
Contact us →